MISTy Spatial Colocalization Analysis Training Guide
Introduction
TIP
MISTy (Multiview Intercellular SpaTial modeling framework) is a multiview spatial modeling framework designed for ligand–receptor colocalization analysis in spatial transcriptomics and spatial proteomics datasets. By combining intrapcell, neighboring-cell, and distal-cell information through machine-learning models, MISTy quantifies the strength and significance of spatial colocalization for ligand–receptor (L–R) pairs, enabling rapid prioritization of candidate signaling interactions supported by spatial proximity.
Understanding spatial relationships among cells is critical for revealing tissue function and disease mechanisms. MISTy integrates gene expression with spatial distance, computes a colocalization score and significance for each candidate L–R pair, and delivers high-confidence candidates for downstream communication modeling (e.g., CellChat_spatial, COMMOT) and experimental validation.
Core Capabilities of MISTy
- Multiview spatial colocalization scoring – evaluates each L–R pair across intra-cellular, neighboring-cell, and distal-cell views to obtain spatial proximity and statistical significance.
- Machine-learning modeling – employs random forests or similar models to integrate multiview information and output colocalization scores and feature importance.
- Configurable spatial neighborhoods – supports radius- or k-nearest-neighbor-based definitions to match varying spatial resolutions.
This document provides an in-depth guide to MISTy, covering its theoretical basis, operation on the SeekSoul™ Online cloud platform, result interpretation, practical case studies, best practices, and frequently asked questions, so you can efficiently conduct ligand–receptor spatial colocalization analyses.
MISTy Theory Overview
MISTy’s core concept is to leverage a multiview machine-learning framework that integrates intra-cellular, neighboring-cell, and distal-cell interactions to determine whether ligand L and receptor R exhibit spatial proximity beyond random expectation. The typical pipeline includes:
- Candidate pair generation – filter expressed L–R pairs from built-in or user-provided databases, optionally using expression thresholds.
- Multiview construction
- Intra-cell view: uses each cell’s own gene expression.
- Neighbor view: aggregates expression from spatially neighboring cells (e.g., k nearest neighbors or fixed-radius neighbors).
- Distal view: captures expression from more distant cells based on spatial distances.
- Machine-learning modeling – train random forests or similar models that integrate all views to predict target gene expression.
- Colocalization scoring – derive L–R colocalization scores and significance from model feature-importance metrics.
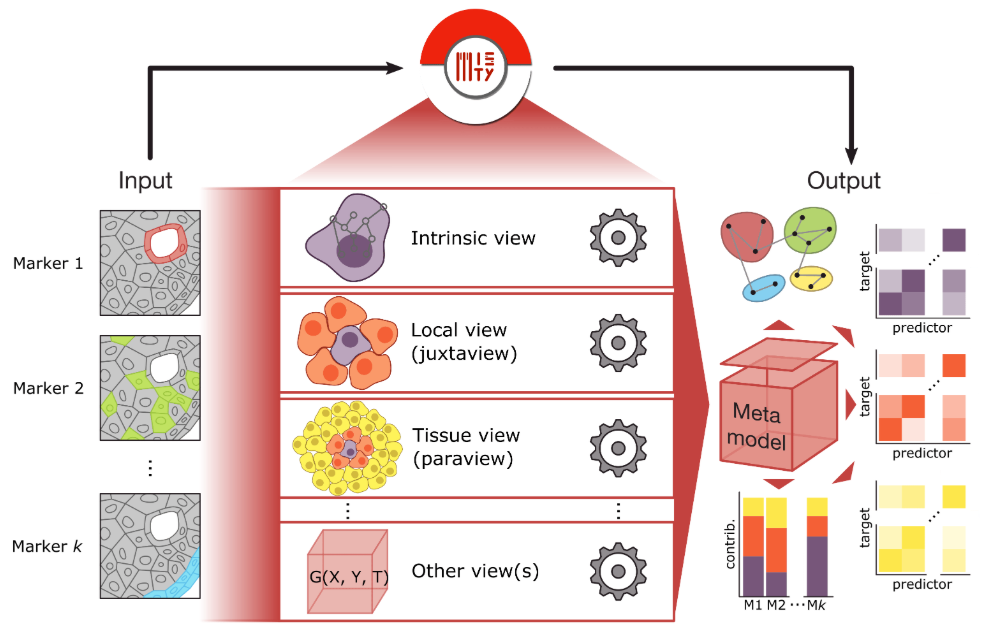
Figure: MISTy analysis pipeline. Candidate L–R pairs are filtered, multiview representations constructed, machine-learning models trained, and colocalization scores plus significance estimates produced.
Key Methodological Highlights
Multiview construction
- Intra-cell view: direct use of each cell’s own expression profile.
- Neighbor view: define spatial neighbors via k-NN or fixed radius and compute aggregated neighbor expression.
- Distal view: define long-range neighborhoods to capture broader spatial influences.
Machine-learning modeling
- Integrate multiview features via random forests or gradient boosting models.
- Use feature-importance scores to quantify the contribution of each view to the target gene.
- Colocalization scores are derived from these importance values.
Significance assessment
- Apply permutation testing or cross-validation to assess score significance.
- Correct for multiple testing (FDR) across numerous L–R pairs to control false discoveries.
SeekSoul™ Online Platform Workflow
On the SeekSoul™ Online cloud platform, MISTy is implemented as a user-friendly workflow—no coding required. Configure the parameters and submit the job.
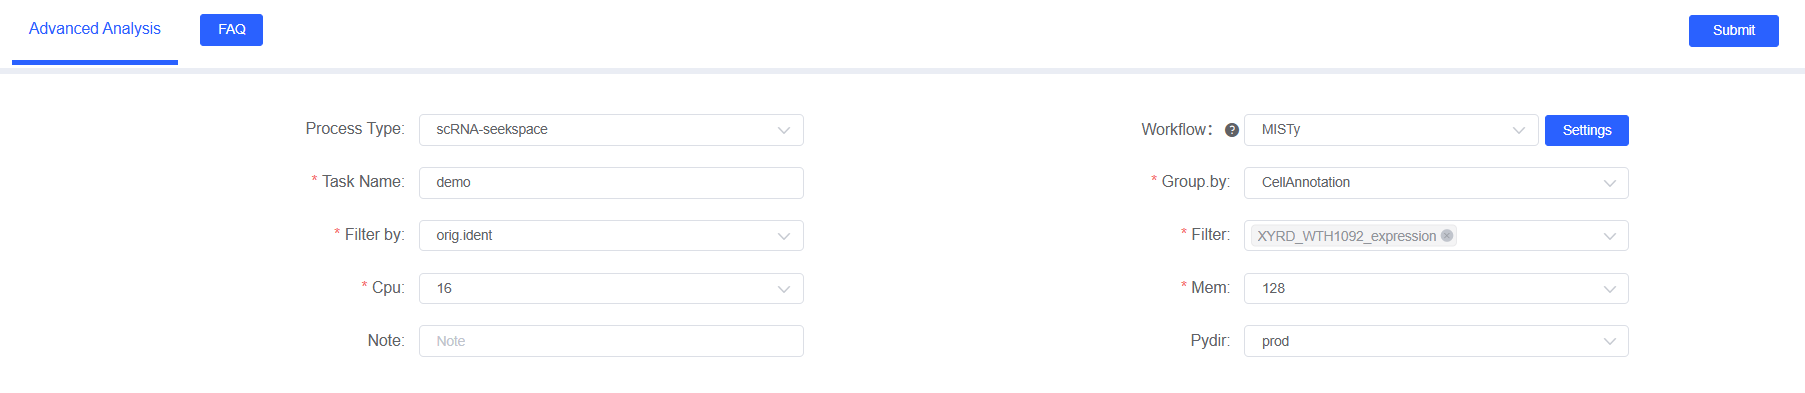
Parameter Configuration
In the “Advanced Analysis” module, select “MISTy” and provide the following parameters:
Basic Parameters
Task Name
- Description: Name of the analysis task.
- Format: Must begin with a letter; letters, numbers, underscores, and Chinese characters are allowed.
- Example:
MISTy_analysis.
Grouping by
- Description: Column in the metadata specifying cell-type labels.
- Examples:
CellAnnotation,celltype. - Purpose: Defines cell types to analyze spatial colocalization across cell-type pairs.
Sample Filter Parameters
Filter by
- Description: Metadata column containing sample identifiers.
- Examples:
Sample,GD.N_A.
Filter
- Description: Sample IDs selected from the filter column.
- Examples:
A15,sample1.
Note
- Description: Optional free-text notes (optional).
Operating Steps
- Navigate to “Advanced Analysis” and choose the “MISTy” module.
- Select grouping factor and samples.
- Submit the job and wait for completion.
- Download and inspect the HTML report and exported files.
Result Interpretation
The report provides heatmaps, network diagrams, and exported files summarizing colocalization relationships.
Cell-Type Colocalization Heatmap
Example: celltype_colocation_heatmap.png
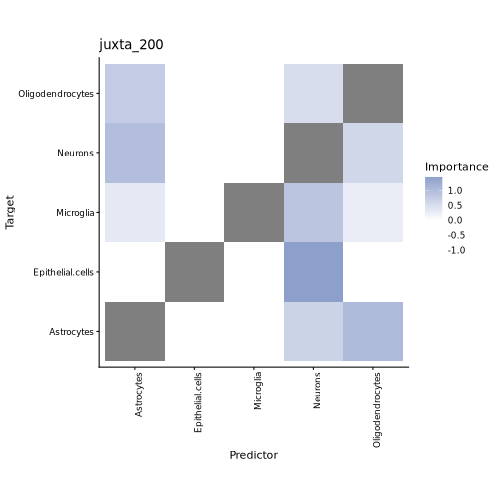
How to read it:
- Columns: Target cell types receiving putative signaling influences.
- Rows: Source (driver) cell types contributing spatial effects.
- Color: MISTy-estimated spatial influence/colocalization score—the darker the color, the stronger the inferred interaction.
Cell-Type Colocalization Network
Example: celltype_colocation_network.png
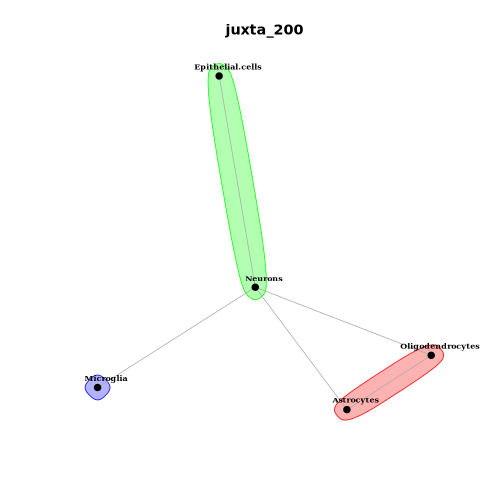
How to read it:
- Nodes: Cell types; nodes in the same circle (or cluster) typically indicate mutual spatial influence.
- Edges: Edge thickness/color reflect colocalization score magnitude; directional arrows (if shown) indicate source-to-target directionality.
- Concentric circles: Different rings distinguish bidirectional vs. unidirectional interactions; cross-ring edges suggest asymmetric spatial influence, warranting validation via the heatmap and biological context.
Exported Files
| File Name | Description |
|---|---|
celltype_colocation_heatmap.png | Cell-type colocalization heatmap |
celltype_colocation_network.png | Cell-type colocalization network |
TIP
Suggested workflow: Identify significant L–R pairs from the summary statistics, inspect the heatmap and network for spatial hotspots, then consult exported files for quantitative evidence supporting downstream analyses or experimental planning.
Case Studies
Ligand–Receptor Colocalization in Human Myocardial Infarction
- Background: Characterize key L–R pairs among cardiomyocytes, fibroblasts, immune cells, and other populations, relating spatial colocalization to inflammation and tissue repair after myocardial infarction (MI).
- Data: Spatial multi-omic profiling of human MI tissue (31 samples from 23 patients) including snRNA-seq, snATAC-seq, and spatial transcriptomics covering infarct, border, and remote zones.
- Findings: MISTy reveals striking cell-type heterogeneity and significant L–R colocalization across zones, highlighting interaction networks among cardiomyocytes, fibroblasts, and immune cells. Colocalization hotspots align with inflammation and remodeling processes in specific zones.
- Implication: Provides a spatial communication map guiding mechanistic insights into post-MI remodeling and identifying potential therapeutic targets.
MISTy Result Snapshot
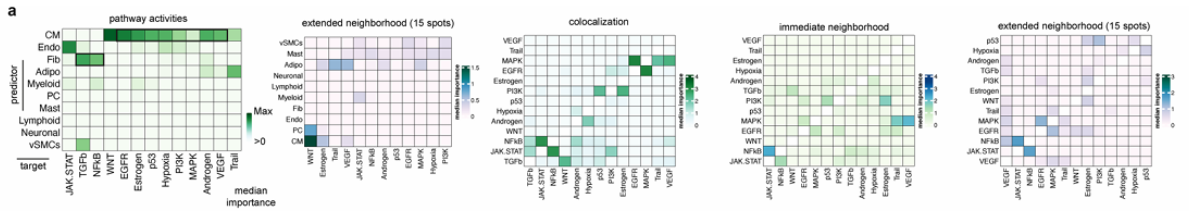
Extended Data Fig. 4a: Shows spatial hotspots of key cell-type interactions across infarct, border, and remote zones, such as enhanced fibroblast–immune and endothelial–immune communication during inflammatory and reparative phases.
Colocalization in Primary and Metastatic Pancreatic Cancer
- Background: Identify critical L–R pairs among tumor cells, immune cells, and fibroblasts in matched primary and metastatic pancreatic ductal adenocarcinoma (PDAC) samples, revealing microenvironmental heterogeneity.
- Data: Spatial transcriptomics of matched primary and metastatic PDAC, profiling conserved spatial eco-types (fibrotic, metabolic, immunosuppressive) across anatomical regions.
- Findings: MISTy uncovers distinct spatial organization and gene-expression patterns between primary and metastatic sites, highlighting complex interaction networks among tumor, immune, and stromal populations. Conserved eco-types show characteristic L–R colocalization signatures across regions.
- Implication: Emphasizes PDAC microenvironment heterogeneity beyond prior knowledge and motivates patient-specific spatial mapping to inform targeted therapies.
MISTy Result Snapshot
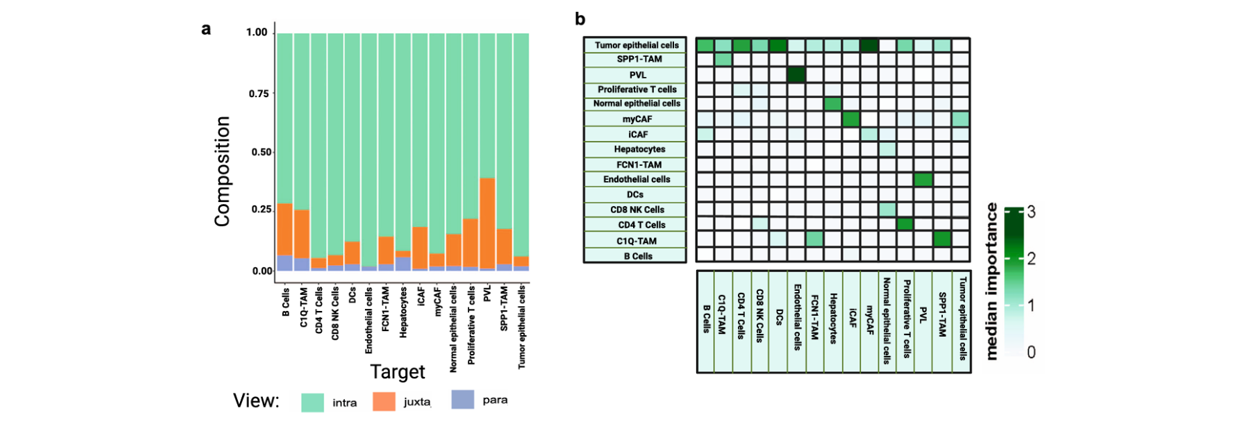
Extended Data Fig. 2: (a) Contrasts cell-type compositions and spatial distributions across fibrotic, metabolic, and immunosuppressive eco-types in primary vs. metastatic PDAC. (b) Highlights spatial adjacency and signaling hotspots where immune cells interact with tumor cells or fibroblasts along eco-type boundaries.
Notes and Best Practices
WARNING
- Spatial colocalization ≠ causal communication: Colocalization indicates proximity, not causality. Validate with expression magnitude, pathway knowledge, functional assays, or orthogonal datasets.
- Parameter sensitivity: Neighborhood definitions for neighbor/distal views profoundly impact results; perform sensitivity analyses.
- Resolution and mixture effects: Spot-level data may mix multiple cell types; consider deconvolution or validate on single-cell resolution data.
- Model selection: Different machine-learning models (random forests, gradient boosting) may yield different outcomes; compare and choose models suited to your data.
- Data quality: High-quality spatial expression matrices and coordinates are critical; remove low-quality cells/spots and apply proper normalization/batch correction.
TIP
Best Practices
- Parameter tuning – Adjust neighborhood sizes for single-cell vs. spot data, evaluate sensitivity to different k or radius settings, and select parameters that align with known biology.
- Model validation – Cross-validate models, compare with other communication tools (COMMOT, CellChat_spatial), and prioritize L–R pairs consistently significant across methods.
- Multiview interpretation – Examine feature-importance scores per view; high neighbor-view importance suggests short-range interactions, whereas high distal-view importance implies long-range signaling.
- Preprocessing consistency – Standardize preprocessing and annotations to reduce batch effects when comparing samples; set reasonable thresholds for lowly expressed genes.
- Visualization – Use spatial scatterplots, density maps, and zoomed panels to visualize colocalization hotspots; plot per-view importance heatmaps to interpret interaction modes.
- Biological validation – Cross-reference findings with literature, replicate across samples/conditions, and plan functional experiments for high-priority L–R pairs.
Frequently Asked Questions (FAQ)
Q1: How does MISTy differ from traditional single-view approaches? A: MISTy integrates intra-cell, neighbor, and distal views, capturing spatial influences at multiple scales. Single-view methods typically consider only cell-intrinsic expression or simple proximity, whereas MISTy disentangles contributions from different spatial ranges and yields more interpretable colocalization scores.
Q2: How should I interpret MISTy colocalization scores? A: Scores derive from feature-importance metrics of the machine-learning model (e.g., random forest). Higher scores indicate stronger spatial colocalization. Examining per-view feature importance reveals how each spatial view contributes to the interaction.
Q3: How do I choose neighborhood parameters for neighbor and distal views? A: Calibrate parameters based on data resolution and tissue structure. For single-cell resolution, fixed radii of 100–200 μm or small k values are common; adjust and perform sensitivity checks to ensure robustness.
Q4: What data quality does MISTy require? A: Accurate expression matrices and spatial coordinates are essential. Apply quality-control filters, normalization, and batch correction. For lowly expressed ligands/receptors, set thresholds or focus on historically strong candidates to avoid false positives.
Q5: How do MISTy results compare with other spatial communication tools? A: MISTy emphasizes spatial proximity learned via machine learning, whereas other tools may focus on expression correlations or pathway models. Cross-validate and prioritize L–R pairs appearing significant in multiple tools to boost confidence.
Q6: How long does MISTy take to run? A: Runtime depends on data size, number of candidate L–R pairs, and model complexity. Medium-sized datasets (thousands of cells/spots, hundreds of L–R pairs) typically complete within minutes to tens of minutes.
Q7: How should I interpret the importance of different views in MISTy results? A: MISTy outputs importance scores for intra-, neighbor-, and distal views. High neighbor-view importance indicates nearby cells strongly influence the target; high distal-view importance suggests longer-range spatial interactions, prompting deeper biological investigation.
References
- GitHub:
https://github.com/saezlab/mistyR - Tanevski, J., Flores, R. O. R., Gabor, A. et al. Explainable multiview framework for dissecting spatial relationships from highly multiplexed data. Genome Biology 23, 97 (2022).
- Kuppe, C., Ramirez Flores, R. O., Li, Z. et al. Spatial multi-omic map of human myocardial infarction. Nature 608, 766–777 (2022).
- Khaliq, A. M., Rajamohan, M., Saeed, O. et al. Spatial transcriptomic analysis of primary and metastatic pancreatic cancers highlights tumor microenvironmental heterogeneity. Nature Genetics 56, 2455–2465 (2024).
Summary
MISTy delivers a multiview machine-learning framework for ligand–receptor spatial colocalization, integrating intra-, neighbor-, and distal-cell information to capture spatial interactions comprehensively. Combined with communication tools such as COMMOT or CellChat_spatial, MISTy helps triangulate evidence from spatial proximity and signaling models, enabling confident identification of functional interactions and guiding spatial imaging and functional experiments.